 This long and detailed article will look at how Southampton have performed when playing home and away this season; hopefully we will see patterns of positivity from the statistics produced as well as areas of Saints play that could see improvements for next season in the Premier League.
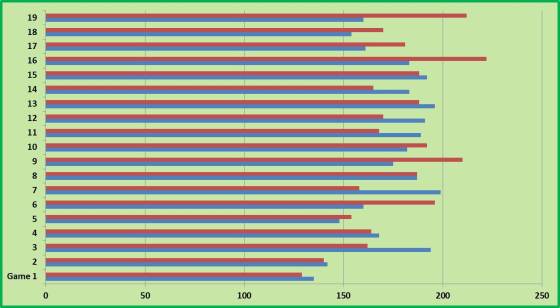
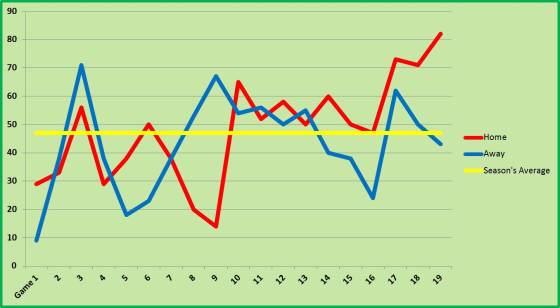
For starters we can see the overall statistics of how Southampton have fared at Home and Away below.
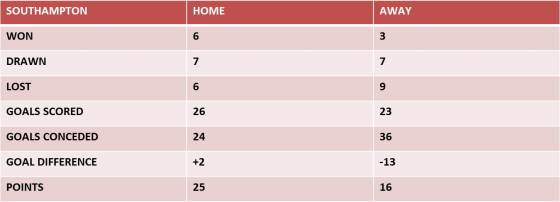 As any Saints fan would hope we have picked up more points at Home than Away, especially with notable wins against Manchester City, Liverpool and Chelsea under Mauricio Pochettino. The only disappointment is the fact we lost to teams such as Wigan Athletic and Queens Park Rangers where Saints should be taking all three points. In terms of Away games Saints picked up some crucial points on the road; however they lacked defensive fight which enabled teams to get back at them which resulted in a lot of goals being conceded. This is the gap that I feel will need to be sorted this summer to help see Saints progress up the league.
If we take a look at when goals have been scored and conceded it can help us understand when Saints tend to be dangerous at scoring, but also give us the opportunity to show when we concede and how it can be stopped.
GOALS SCORED (TIME)
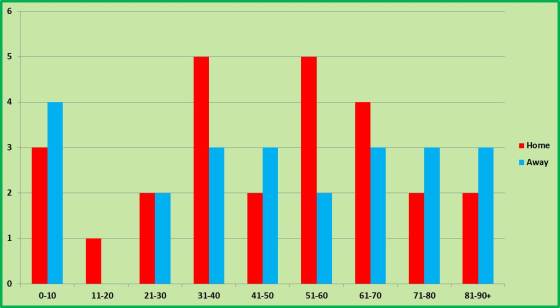 Firstly, the graph shows all the goals that have been scored Home and Away, within the graph Saints tend to start games brightly with 7 goals scored in the first 10 minutes. The next time phase 11-20 minutes shows Saints dry patch with only 1 goal in that period of play. Interestingly the 10 minute period before the 40th and the 10 minutes after the 51st has seen Saints score 15 goals, this could be down to the Manager’s half time team talk. Another positive point is the fact Saints have proved that they can score late on in games, with 10 goals in the last 20 minutes; in particular Jose Fonte last minute equaliser against Fulham at St. Mary’s.
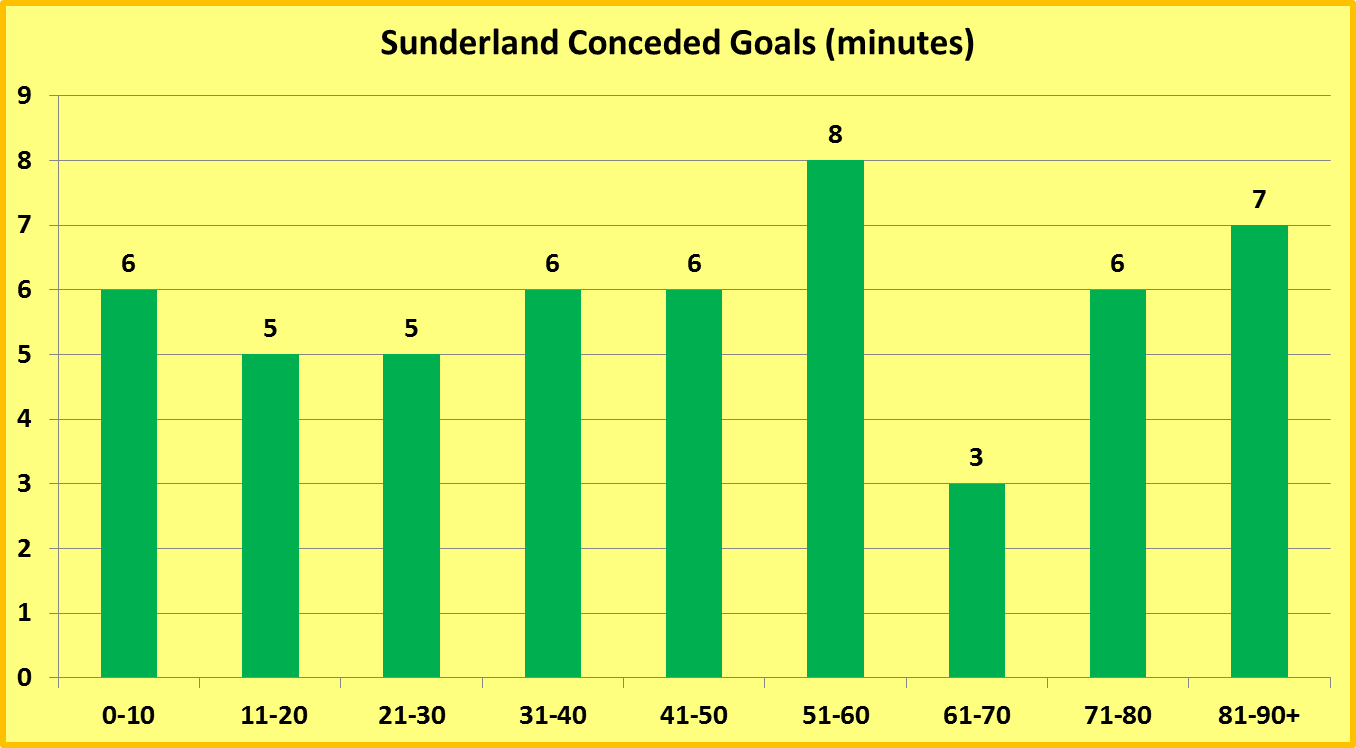
GOALS CONCEDED (TIME)
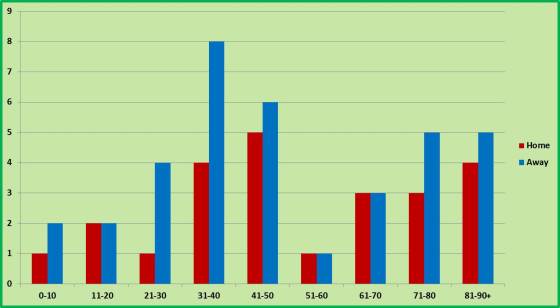 If we look at Goals Conceded we can see that the dry period Saints had when scoring (11-20mins) is also a period where they have conceded 4 goals; despite this the main problem lies between the 15 minutes before and the 5 minutes after half-time as Saints have shipped 23 goals in that time. For me there is nothing more frustrating than conceding before the break, this could also explain why Saints have scored a lot of goals between the 51-60th minute because they have had to come out and attack teams to get back in the game, which has resulted in only 2 goals being conceded in that time frame. But, one of Saints biggest downfalls is conceding late on in the game with 17 goals in the last 20 minutes being conceded; games such as Manchester United at Home and Wigan Away prove that no matter what the time or the score is you have to keep switched on for the full 90+ minutes the game lasts for.
GOALS SCORED AND CONCEDED AT HOME
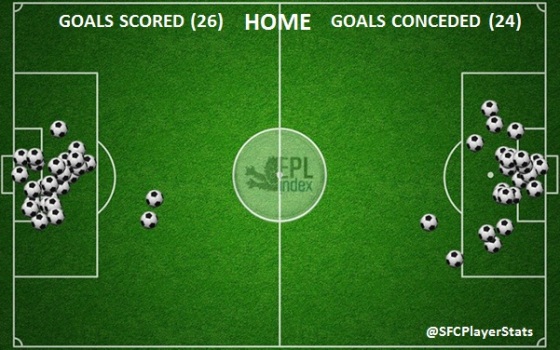 This season has seen Saints finish up with a Goal Difference of +2 at Home; the majority of the 26 goals have been scored from within the Penalty Area, with the only goals outside the area scored from Rickie Lambert’s free kicks against Liverpool and Chelsea. A specific cluster of goals scored can be seen on the corner of the 6 yard box, we have seen Lambert a number of times isolate the opposition fullback in order to gain an aerial advantage to get a shot on goal.
However, as well as Saints looking to isolate the fullback, the opposition have also used the same pattern of play against Saints, such as Gareth Bale and Robin Van Persie pulling off at the far post before expertly finishing it in the goal. Despite being the subject of quality finishing from these players we have also been the masters of our own downfall with basic defensive errors that have gifted the opposition goals. This includes Gazzaniga/Yoshida’s error against Swansea and Jose Fonte getting dispossessed of possession against Wigan Athletic.
GOALS SCORED AND CONCEDED AWAY
Having seen where Saints score and concede, it’s important to look at where Saints have been scoring and conceding the goals Away from Home; as this can help Saints patch up certain areas of weakness ahead of the new season.
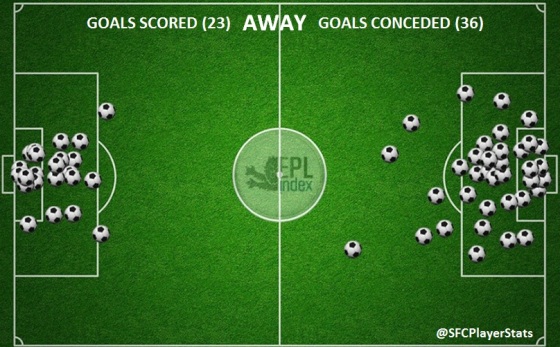 Just like Goals Scored at Home a lot of the goals have been scored inside the Penalty Area, with 9 goals being scored within the 6 yard box, this shows the poachers instinct from Saints which has no doubt helped pick up the odd point or three. However, I believe we still should be looking at more shots on goal from outside the area, in this day and age teams are so compact and tight in and around the box by the time you want to get a shot off it has been blocked or shielded out wide. Therefore, I feel when Saints get into the Final Third they should up the tempo giving the opposition no time to get tight which will leave room for more shots on goal.
The Goals Conceded has a different story as the goals that Saints have let in have come from all over the pitch, it’s typical that Saints have come across world class strikes that the players will most likely never replicate, such as Cameron Jerome…however, you can’t fault the fact they have actually had a shot on goal from distance. Interestingly, there is a cluster of goals around the Penalty Spot which could indicate late runs from the opposition that might not have been picked up by the Saints players, or the Saints players didn’t get tight enough to the opposition to prevent the shot from going in.
DEFENSIVE
TACKLE WIN PERCENTAGE %
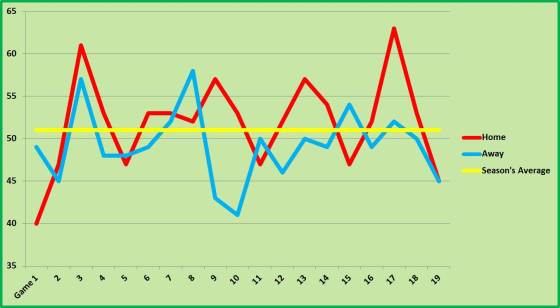
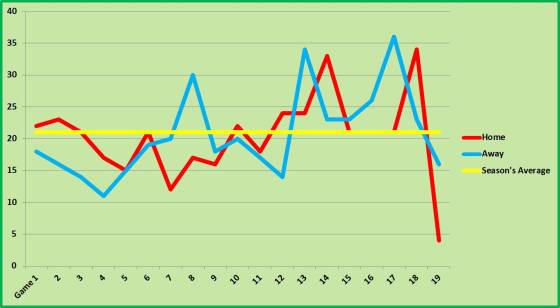
 In general Saints tackling this season has been particularly good with Saints preventing the opposition a number of times, as the graph shows on 5 occasions Saints have had a tackling win percentage of over 90%. Individually Morgan Schneiderlin has attempted the most tackles (146), whilst Jack Cork was the most successful winning 87% of his tackles. This season Saints have averaged a tackling win percentage of 78% at Home, whereas the win percentage Away is 76%. The end of the season Saints seemed to struggle to win the ball through tackling with a notable drop under the season’s average from Game 14 to 18; this could be down to the fatigue of the players as Pochettino aggressive pressing finally took its toll on the players in the closing fixtures.
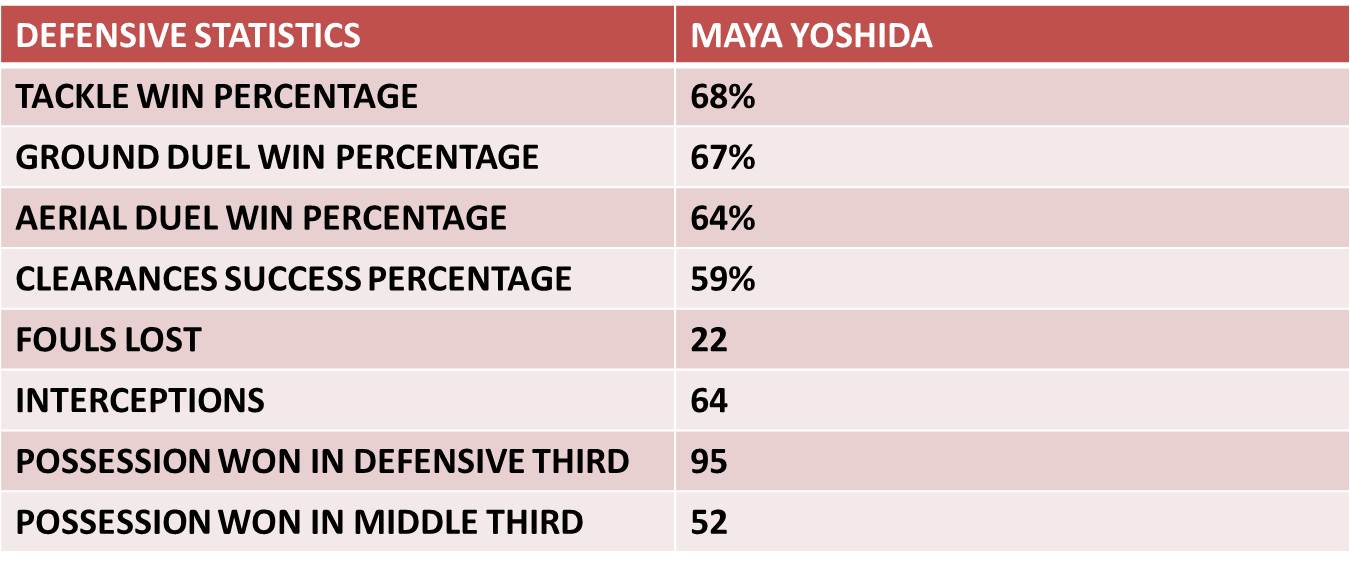
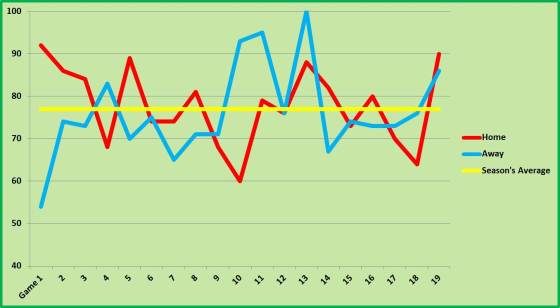
GROUND DUEL WIN PERCENTAGE %
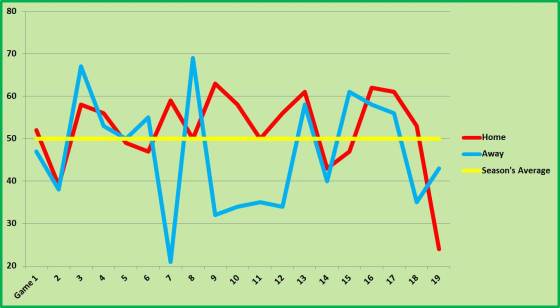
 Throughout the season we can see from the graph that Saints have excelled at winning Ground Duels whilst playing at Home, but struggled when playing away having only been over the Season’s Average 5 times over the course of the season. As a result the winning percentage at Home is 52%, whereas Away is 49%. Individually Morgan Schneiderlin has attempted the most Ground Duels (325), whilst Maya Yoshida has had the better of the opposition’s strike force having successfully won 68% of his Ground Duels. Rickie Lambert on the other hand had a tougher time against the opposition defence with a win percentage of only 34%.
AERIAL WIN PERCENTAGE %
 This season Saints have attempted a total of 1248 Aerial Duels with an average win percentage of 50%, but when you look at how Saints fared Home and Away we can get a clearer picture of how Saints have attempted these duels. For instance, the graph shows a lot of blue line below the average line which indicates a struggle when away from home; whereas at Home Saints aerial duel win percentage is 52%, therefore proving how difficult the opposition find it when attempting aerial duels, unless of course your team name is Stoke City who annihilated are aerial duels winning 76% of the aerial balls. This season Jos Hooiveld has been the most successful in the air winning 75% of his aerial duels, whereas Rickie Lambert has attempted the most aerial balls (201).
POSSESSION
TOUCHES (HOME)
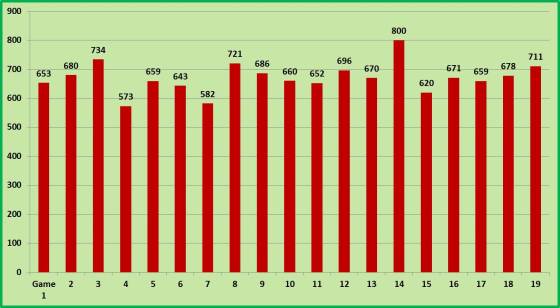 This season Saints have touched the ball 12748 times whilst playing at St. Mary’s; averaging 671 touches per game. Despite having a lot of touches of the ball it’s important you use it wisely to help exploit the opposition, for example in Game 14 against QPR Saints had the most touches of the ball this season but lost 2-1, whereas in Game 7 Saints only touched the ball 582 times yet beat Newcastle United 2-1.
TOUCHES (AWAY)
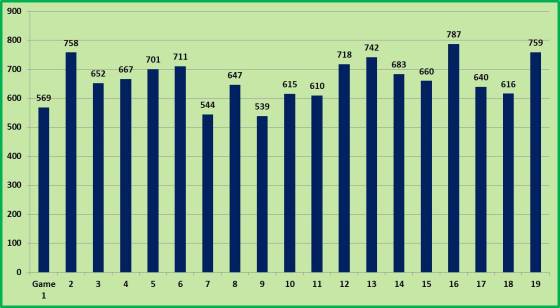 In terms of touches of the ball away from home; Saints amassed a total of 12618 touches of the ball, with an average of 664 touches every game. Therefore, showing that Saints are more than comfortable in possession of the ball when going to other Premier League grounds, the confidence shown by the team can be seen from Games 1 to 6 where there is an increase in touches of the ball as each game passes.
This season Morgan Schneiderlin has touched the ball 2499 times the most from any Saints player, this comes as no surprise as Morgan helps maintain possession of the ball in all thirds of the pitch as he helps link up the defence to the midfield and midfield to the attacking players.
LOSS OF POSSESSION
 BLUE – HOME
RED – AWAY
Losing possession of the ball is a frustrating feeling when Saints gather momentum when attacking the opposition, I know from being at the ground that fans believe we lose possession of the ball more when we lose a game than when we win. But, I analysed this in my last article which stated that ‘Saints actually lose more possession of the ball when we win than when we lose’ this was down to a number of reasons such as passes played forward and how many touches of the ball Saints had. As a result if the team are using the ball effectively then losing possession isn’t too bad as the team are still creating chances, but if they’re not then that’s when Saints start to lose or draw games.
Looking at the graph we can see that in the first five games of the season Saints tended to lose the same amount of possession when playing at Home and Away, whereas from Game 11 to 15 Saints lost more possession at Home than when Away, but the last four games of the season Saints lost more possession Away than Home; therefore, Saints tended to lose possession in specific stages of the season.
This season Saints have lost the ball 6655 times; individually Rickie Lambert has lost possession of the ball 610 times this season, more than any other player at Saints.
INTERCEPTIONS
 For me this is the best graph of the whole article, simply because you can see the sudden increase of interceptions made since Mauricio Pochettino took over from Nigel Adkins. Pochettino first game against Everton is Game 11 on the graph, as we can clearly see Saints have adopted his pressing game forcing the opposition into mistakes and picking up possession through wayward passes made by the opposing team. I believe this has had the biggest effect on how teams have struggled to break Saints down, this is due to the constant pressure they’re under when in possession of the ball by the Saints players. As a result Mauricio ended up with a Goal Difference of -1, whereas under Nigel Adkins it was -10.
Once again Morgan Schneiderlin topped the charts with 139 interceptions, Nathaniel Clyne with the second most intercepting the ball 72 times for Saints.
DISCIPLINE
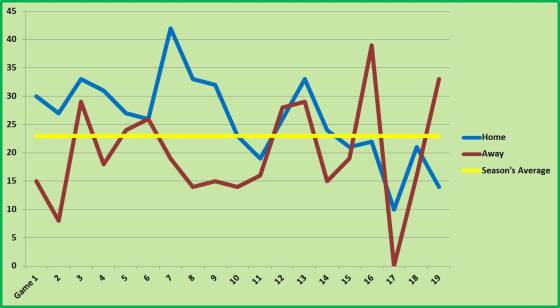
FOULS WON
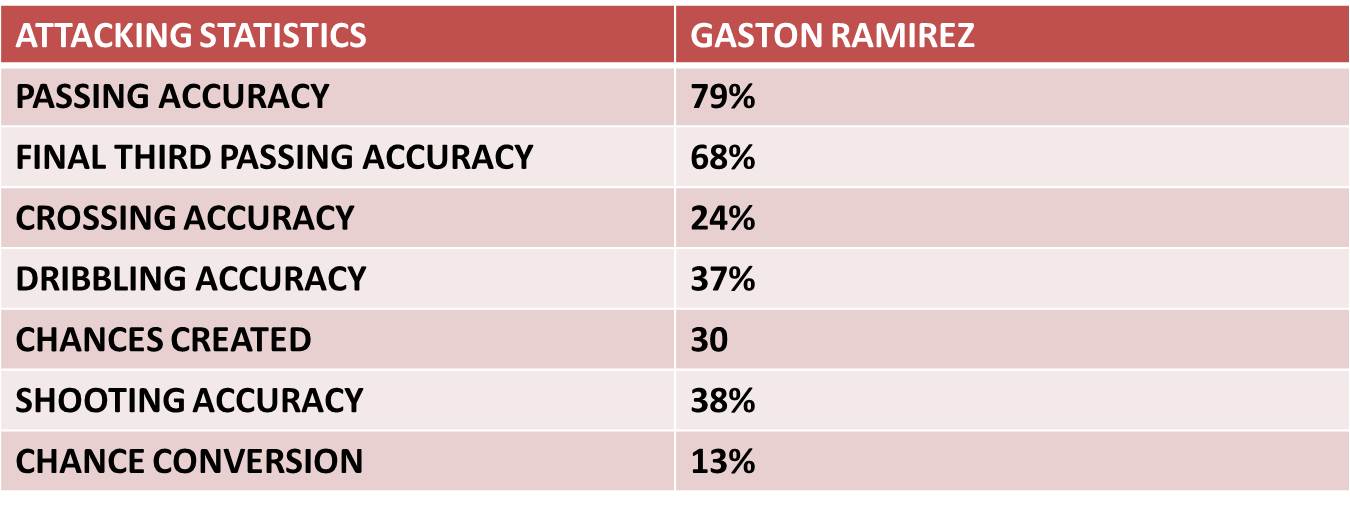
 This Premier League season has seen Saints win a total of 357 fouls, as we can see the graph has fluctuated quite frequently over the course of the season, for example, at times Saints win over 12 fouls in one game before only winning 6 in the next. This season has seen Gaston Ramirez fouled 44 times making him the most fouled player at Saints; the Saints Full Backs have also won their fair share of fouls as they look to attack down the channels at the opposing teams wingers and fullbacks, Nathaniel Clyne winning 18 and Luke Shaw 25 fouls this season.
FOULS LOST
 Saints have averaged 11 fouls lost per game, in comparison Saints averaged 9 fouls won per game. Consequently giving away more than we win; this has had an effect on results as games such as Manchester United Away where Saints conceded fouls outside the area led to goals being scored by the opposition. In this league any foul you give away outside the box that can be delivered into a dangerous area can lead to a big chance, these chances will most likely be put away due to the standard of player in this division.
This season has seen the opposing team win more fouls than Saints; this comes as no surprise as the Saints players get tight to the opposition players due to the aggressive pressing. In the Premier League Morgan Schneiderlin has lost 65 fouls, as mentioned above Morgan is one of Saints main enforcers in terms of pressing and squeezing the opposition out of possession so will no doubt lose some fouls over the course of the season.
Due to Saints pressing high a lot of the fouls lost are in the opposition’s half, therefore the Saints attacking players have lost quite a lot of fouls as well, Jason Puncheon lost 37, Jay Rodriguez 37, Gaston Ramirez 33 and Rickie Lambert 35 fouls in total.
YELLOW AND RED CARDS
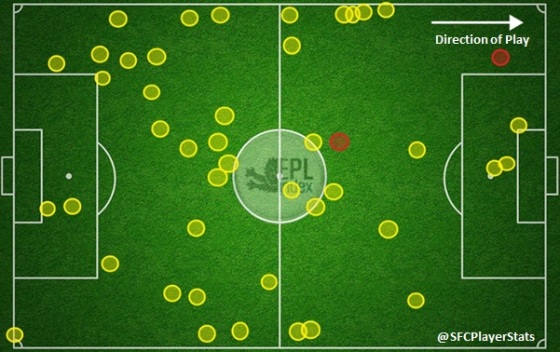 The Yellow and Red Card Map show us where the majority of the cards have been awarded to the players, as we can see the cards have been mainly distributed in the Southampton half with the majority out wide on the left hand side. This season Saints have averaged 1.18 cards per match, therefore showing how disciplined the team have been over the course of the year, a number of other Premier League teams have suffered due to ill-discipline of the players which has left the team in trouble due to top players facing suspension.
This season’s bad boy goes to Morgan Schneiderlin with 9 Yellow Cards to his name, followed by the defensive duo of Jos Hooiveld and Jose Fonte with 5 Yellow Cards.
PASSING ACCURACY %
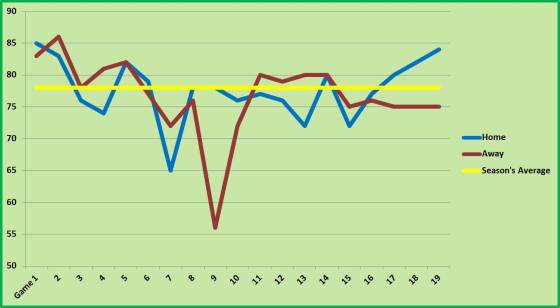 Passing has become an integral part of Saints game this season with specific variations that have seen teams struggle to cope with Saints high tempo passing, this is because they can play it short but have the option to play it long into Lambert who is capable of holding the ball up. Saints Passing Accuracy has averaged at 78% this season with Saints passing at home also averaging at 78%, whilst playing away has seen a slight drop to 77%. From Game 7 to 13 at Home we can see that Saints dropped in terms of Passing Accuracy as it failed to get above the average line. However, from Game 16 to 19 Saints picked up the accuracy as it increased over the games. Game 9 away from home has seen a massive drop in accuracy, hardly surprising the team that we played was Stoke City.
This season Morgan Schneiderlin attempted 1873 passes at a Passing Accuracy of 85%, by far the most accomplished passer in the side; although Steven Davis also managed an accuracy of 85% having attempted 1311 passes.
FINAL THIRD PASSES
 The Final Third passes shows how fundamental it is to get the ball into these areas if you look to penetrate the opposition’s defence, for example Game 13 against Manchester City at Home Saints played 173 passes in the Final Third, 21more passes than the average this season; as a result Saints won 3-1. However they attempted even more in the next game but couldn’t breakthrough the QPR defence and lost, but Saints still maintained a high number of Final Third passes and beat the likes of Chelsea and Liverpool in the next Home games. But, just like some of the graphs above we have a seen a drop below the season’s average in the final few games Home and Away, in this case Saints haven’t managed to get enough passes played in the Final Third, which has subsequently led to only 3 goals being scored in the Final 6 games of the season Home and Away.
There have been 5582 passes played in the Final Third with Rickie Lambert playing 770 passes in that third of the pitch, Jason Puncheon the most accurate with a 75% accuracy from 405 passes made in the Final Third.
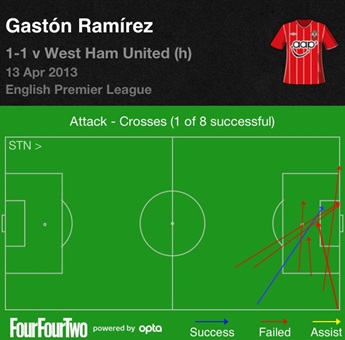
CROSSING ACCURACY %
 I’m sure some people will believe that Southampton’s Crossing Accuracy has been poor this season, especially the latter part; but all in all the crossing hasn’t been too bad, for instance the first 10 games at Home we can see that the Saints players have found their teammates fairly often with a high accuracy, despite the fact the crossing away from home is slightly disappointing. In comparison with other teams Manchester United Crossing Season’s Average is 22%, West Ham United is 27% and Queens Park Rangers is 20%, therefore Saints haven’t done to badly with their crossing; although I will say that Saints have certainly struggled in the closing part of the season having seen the Home average drop in the last 7 games.
Individually Steven Davis has the best accuracy with 37% of his crosses finding a Saints player, whereas Adam Lallana has attempted 146 (most) crosses at an accuracy of 16%.
DRIBBLING ACCURACY %
 I believe dribbling has been an important aspect of Saints play this season, this is because Saints have players more than capable of beating the oppositions players with the ball at their feet, for example we have the two fullbacks in Clyne and Shaw who have the ability to drive the ball on from deep into the Final Third, Puncheon and Lallana with their flicks in and out putting the opposition players in a daze, as well as Rodriguez and Ramirez who can drive the ball on opening up room in the oppositions defence for Saints to exploit. However, I feel under Adkins the players weren’t given the freedom to run with the ball, which would explain why the dribbling accuracy is low for both home and away games in the first part of the graph, since the managerial change we can see the accuracy level out before it starts to increase in the Home games.
As a result players like Rodriguez flourished as he ended the season with the most dribbles attempted (79), whereas Nathaniel Clyne finished with the best accuracy of 59% from 51 dribbles.
CHANCES CREATED
 To win games in the Premier League you need to create chances, this season Saints averaged 11 chances every game at St. Mary’s. Looking at the graph it looks like a wave with chances created increasing each game before a sudden decrease in each game; this trend appears to happen throughout the season. Despite creating a lot at home I feel that we haven’t used it to our advantage, this is because Southampton have lost 6 games at Home and the two lowest chances created are Games 8 and 11, both ending in draws. Therefore in the games Saints have lost they have still created a minimum of 9 chances and failed to get a positive result from it.
 When Saints travel away we can see from the graph that 15/19 games have seen Saints create less than their Home average, therefore indicating a lack of chances created for the team. However, once again I bring up the managerial change which clearly shows an increase in chances created from Game 12; due to the increased chances we have seen 7 points come from these games as well as 8 goals.
Southampton have a created a total of 367 chances with Rickie Lambert creating the most with 80; more than double of his next Saints teammate Adam Lallana with 40 and Gaston Ramirez 31.
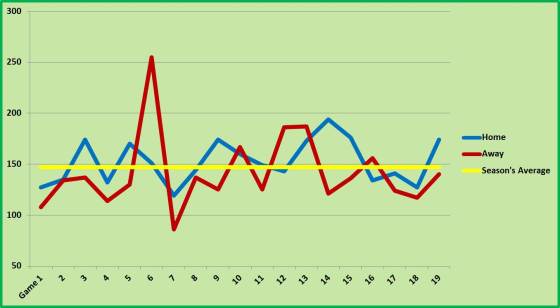
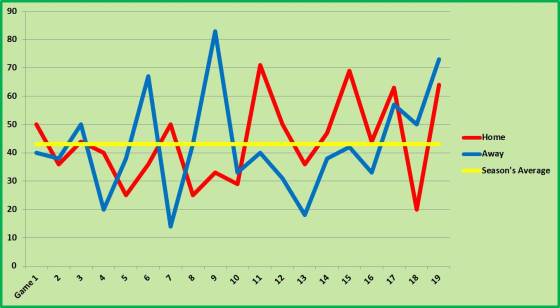
TOTAL SHOTS
 RED – HOME
BLUE – AWAY
As the graph highlights we can see a distinct amount of red which shows how many more shots at Home we have compared to playing Away. This season has seen Southampton have 289 shots on goal at Home and 227 shots on goal Away, with Saints averaging 15 shots a game at Home and 12 shots a game Away. Saints started the season brightly when playing at Home having seen the graph touch 15 shots in 5 of the first 6 games, however they could only muster a measly 4 points in total which no doubt put more pressure on the side as the season wore on. The Away Shots increased dramatically after the 12th Game which also happens to be Pochettino first game in charge.
Rickie Lambert has attempted 94 shots on goal this season, with Jay Rodriguez closely behind firing 89 shots on goal.
SHOOTING ACCURACY %
 It’s important for Saints to have shots on goal but it’s far more important that the shots on goal are accurate to help increase the chances of scoring, this season Saints have a Shooting Accuracy of 43%. The graph shows the accuracy of the shot has fluctuated quite rapidly over the course of the season, but what we can see is the low accuracy in the first half of the season when shooting at Home, however this then increases in the second half from Game 11 as the accuracy at Home only drops below the average twice in the 9 games.
Just like the Total Shots graph we can see Away from Home in the latter part of the season an increase in shots but also an increase in accuracy, which is fundamental in picking up points for the team as Saints are now capable of getting shots on goal with accuracy.
Rickie Lambert has the highest Shot Accuracy for players who have had more than 20 shots, with 52% of his shots being on target.
CONCLUSION
If you’ve made it this far down the page then I must congratulate you on this incredible achievement!!!
Personally, I think this has been a successful season for Saints having gone back to back promotions in the last couple of seasons before finishing up in 14th place in the first season back in the Premier League.
For next season there are areas of Saints game that will need to be improved to take us onto the next level and push us up the league. Personally the four I have posted below I would like to see implemented next season.
Cut down on Goals Conceded before and after Half Time
Attempt more shots from outside the Penalty Area
Dealing with Direct Teams
Create more chances Away from Home
 THANKS FOR READING!!
REFERENCES: EPL INDEX (STATISTICS/TACTICS BOARD) AND SAINTSFC.CO.UK (PICTURES)
 The Premier League season is now six games old and we have seen a completely different side to Saints compared to last year; at this very point last season Saints had conceded 18 goals in the first six games. Currently we sit in 4th (at the time of writing) and have conceded just 2 goals in the opening 6 games. As a unit Saints have broken teams down well minimising any chance that may fall to the opposition in the Defensive Third. For that reason alone the team should be congratulated; there are a number of reasons why Saints have done well defensively, but for me the player that has consistently stood out is Dejan Lovren.


 If there was one thing I would like Dejan Lovren to improve, it would be dealing with opposing players inside the Penalty Area, so far he has managed to get away with it, having tripped Sturridge up at Anfield and I thought he needlessly went into the back of the Palace player in the Penalty Area in yesterday’s game. However, these are things that can be prevented and the most important thing is the fact Saints have only conceded 2 goals in their first 6 games and look like a strong defensive unit. Dejan deservedly got his goal last week and like many fans I have been impressed with his start to his Premier League Campaign! Does he deserve to be the Premier League’s September Player of the Month? I think so.


 I can now tell you that so far this season Saints have had 13 different defensive combinations in the Back Five…37% of the games!! So let’s have a look at the Most and Least Successful Combinations in this Saints team.